
Return on Insight Room
Our blog shares real-world advice, best practices, and tools to help you streamline and scale.
Latest Articles

The Margin You Think You Have vs. The Margin You Actually Have
Every P&L has a gross margin line. Founders watch it. Investors ask about it. It becomes shorthand for how healthy the business is.
But gross margin, as most accounting systems calculate it, is just revenue minus COGS. It does not include freight. It does not include the chargebacks, co-op fees, and shortage claims that retailers deduct before you ever see the cash. An even scarier thought: you often do not see that full impact until 60 days after the revenue hits, once payment finally arrives net of the customer’s deductions and returns.
Timing adds another layer of distortion. Revenue net of those costs is not always recognized in the same period it was earned, which can make true margin look better, or worse, than it actually is. By the time everything clears, the margin you earn on a case, a pallet, or a unit can look nothing like the number sitting at the top of your P&L.
This gap has always existed. What is new is how fast it is widening. Between tariffs, freight, and the expedited shipping brands are paying for to manage both, costs are moving faster than pricing can catch up. When that happens, gross margin stops being useful. It tells you what happened last quarter, not what is happening to your unit economics right now.
Here is how to walk the full path from revenue to true margin, and why more finance teams are rebuilding this walkthrough from scratch.
Start With the Number Everyone Trusts: Revenue
Revenue looks like the simplest line on the P&L. It usually is not.
Gross revenue is what shipped. Net revenue is what you actually get paid for, after returns, cancellations, and allowances that hit before COGS even enters the conversation.
Many brands still build their margin math off gross revenue. That flatters the number before a single cost has been subtracted, and it sets every margin calculation downstream a little too high.
It’s also worth isolating gross from net revenue by channel, since channel is often what drives the gap. Wholesale pricing typically comes with a built-in haircut off MSRP, while DTC pricing usually reflects your true product price. The same SKU can carry two very different net revenue numbers before a single return or allowance is even factored in.
The first fix is simple: start every margin conversation with net revenue, not gross.
COGS: The First Layer Down, and Where Tariffs Now Live
Cost of goods sold used to be reasonably stable. Materials, packaging, and co-pack or labor costs moved a few percentage points a year, and finance teams-built models around that assumption. Tolling agreements and supplier pricing tiers can now shift month over month, which makes it worth tracking the movement in true COGS rather than assuming last quarter’s rate still holds.
That assumption no longer holds for brands sourcing aluminum, steel, or other tariff-exposed inputs.
Section 232 tariffs on aluminum and steel have been adjusted multiple times since February 2025, with rates on aluminum articles moving between 25 percent and 50 percent depending on the proclamation in effect. The most recent adjustment, effective June 2026, kept the headline rate at 50 percent for many aluminum articles while changing how specific derivative products are treated.
For a brand buying aluminum cans, foil packaging, or formed aluminum components, this means the quoted price from a supplier and the landed cost that actually hits COGS can diverge, sometimes within the same quarter.
The lesson is that duties and tariffs now belong inside your COGS build, updated on a cadence that matches how often the rules change, not on the annual schedule most standard cost models still use.
Freight: The Margin Killer Nobody Models
Freight deserves as much scrutiny as COGS.
Inbound freight on imported inputs carries its own tariff exposure. Brands rerouting supply chains to manage duty exposure often pay for longer routes, added handling, or expedited shipping to avoid getting caught by the next rate change. Outbound freight brings its own fuel surcharges and accessorial fees, many of which are billed after the invoice and never make it back into the original cost assumption.
Most finance teams forecast freight once a year and treat it as a fixed percentage of revenue. In a tariff environment, that percentage is not fixed. It moves with fuel prices, carrier capacity, and how far a brand is rerouting its supply chain to manage duty exposure.
If freight is not modeled at the SKU or shipment level, it is very easy for a brand to believe its margin is healthier than it actually is.
Demand planning adds another layer to this. When forecasts do not match actual revenue, it is easy to end up paying for expedited shipping just to keep product available for sale.
Trade Spend and Deductions: The Layer Most Brands Don’t See Coming
This is where the real gap between reported and true margin tends to open up.
Retail and distribution relationships come with their own cost structure: co-op advertising, slotting fees, promotional discounts, shortage and damage claims, and chargebacks for compliance issues that may or may not be legitimate.
Some of these deductions follow a promotional calendar and are fixed and easy to estimate. Others, tied to compliance and logistics issues, are unforeseen and much harder to quantify.
Brands that do not actively track and dispute deductions often assume the number is smaller than it is. In our experience, unmanaged deductions frequently run higher than founders expect, and a meaningful share of them are recoverable with the right documentation and process.
The Real Walkthrough: A Tariff-Driven Compression Example
Here is what this looks like end to end, using a simplified, illustrative example: a CPG brand selling a 12-pack aluminum can multipack through a retail distributor.
The P&L likely surfaces the gross margin line: 48.3% moving to 44.4%, a real but modest-looking 3.9-point decline. Anyone reading only that line might reasonably conclude the tariff impact is manageable.
The true margin tells a different story. Once freight and trade spend are included, true margin falls from 30.9% to 25.8%, a compression of just over 5 points, a meaningfully steeper decline than the reported gross margin drop suggests.
Two things are driving the wider gap. Freight rose alongside the tariff, from added handling and expedited shipping used to manage exposure. Trade spend stayed completely flat, because it is contractually fixed. The tariff increase did not get absorbed once. It hit COGS, compounded through freight, and then sat next to deductions that kept taking the same cut regardless.
Every brand’s inputs, contracts, and freight lanes are different, and the tariff landscape has shifted more than once over the past year and a half. Confirm current, product-specific duty rates before using any number in your own model. What holds regardless of the exact rate: a change that looks small in COGS alone tends to look considerably larger by the time it reaches true margin.
True Margin Also Depends on the Channel
The $4.60 true margin above assumes this case moves through a wholesale or distribution channel. Sell the exact same case direct to consumer instead, and true margin changes again, even though COGS and freight have not moved at all.
Wholesale and distribution channels tend to carry heavier trade spend and chargebacks: co-op advertising, slotting fees, and compliance deductions that retailers collect on a fixed schedule regardless of what is happening to your input costs. DTC and eCommerce channels carry a different load. Discounting tends to run heavier to drive traffic and conversion, and returns processing takes a bigger bite than most wholesale relationships ever see.
Product margin, COGS plus freight, is identical across both rows. True margin is not. On this simplified example, routing the case through DTC instead of wholesale cuts true margin by more than half, purely because of which channel-specific costs apply.
This is why true margin needs to be tracked by channel, not just by SKU. A brand can hold COGS and freight perfectly steady and still watch blended profitability swing several points, simply because channel mix shifted. Net revenue tells you how much came in. True margin by channel tells you which of it you actually got to keep, and it counts for nearly as much as product margin itself.
Why This Gap Is Growing Right Now
Tariff policy on aluminum, steel, and other inputs has changed several times over the past year and a half, and each change resets the math for any brand relying on imported materials.
That volatility is exactly why gross margin, calculated the old way, has become a lagging indicator. A single COGS update, refreshed once a quarter, cannot keep pace with rules that change more often than that.
Brands that are still surprised by margin compression are usually not victims of one bad tariff decision. They are running a margin process built for a slower-moving cost environment.
Building the Habit: A Repeatable Margin Walkthrough
The fix is not a single spreadsheet exercise. It is a habit.
1.Recalculate net revenue by SKU and channel, after returns and allowances, every reporting period.
2.Rebuild landed COGS with current duty and tariff rates, not the rates from the last time someone checked.
3.Model freight at the SKU or shipment level, including fuel surcharges and any rerouting costs.
4.Track deductions as they are actually taken, not as a flat percentage assumption, and dispute the ones that are not legitimate.
5.Recompute true margin monthly, and compare it against the gross margin line so leadership can see the gap, not just the trend.
6.Break out true margin by channel, not just blended, so trade spend and chargebacks in wholesale and promotions and returns in DTC don’t get averaged into a number that describes neither one.
Doing all six consistently, every month, is what separates brands that get surprised by tariff swings from brands that see them coming.
To make this easier to put into practice, we built a companion worksheet that walks through the same revenue-to-true-margin path used above, pre-tariff and post-tariff side by side, so you can drop in your own numbers and see where your margin is actually getting made or lost.
The Bottom Line
Gross margin is not wrong. It is incomplete.
Freight and trade spend are not optional line items to review once a year. They are part of the same margin story as COGS, and in a tariff environment, they are often where the real damage happens.
The brands that manage through tariff volatility well are not the ones with the lowest costs. They are the ones who know, in real time, the difference between the margin they think they have and the margin they actually have.
Not sure whether your reported margin reflects reality? FINNESS Advisors can help you build a true landed-cost and margin walkthrough, line by line, so nothing is hiding between COGS and cash.


Need a Specialized Accounting Firm?
Jun 8, 2026
Find out when it's time to find a firm that speaks your language.
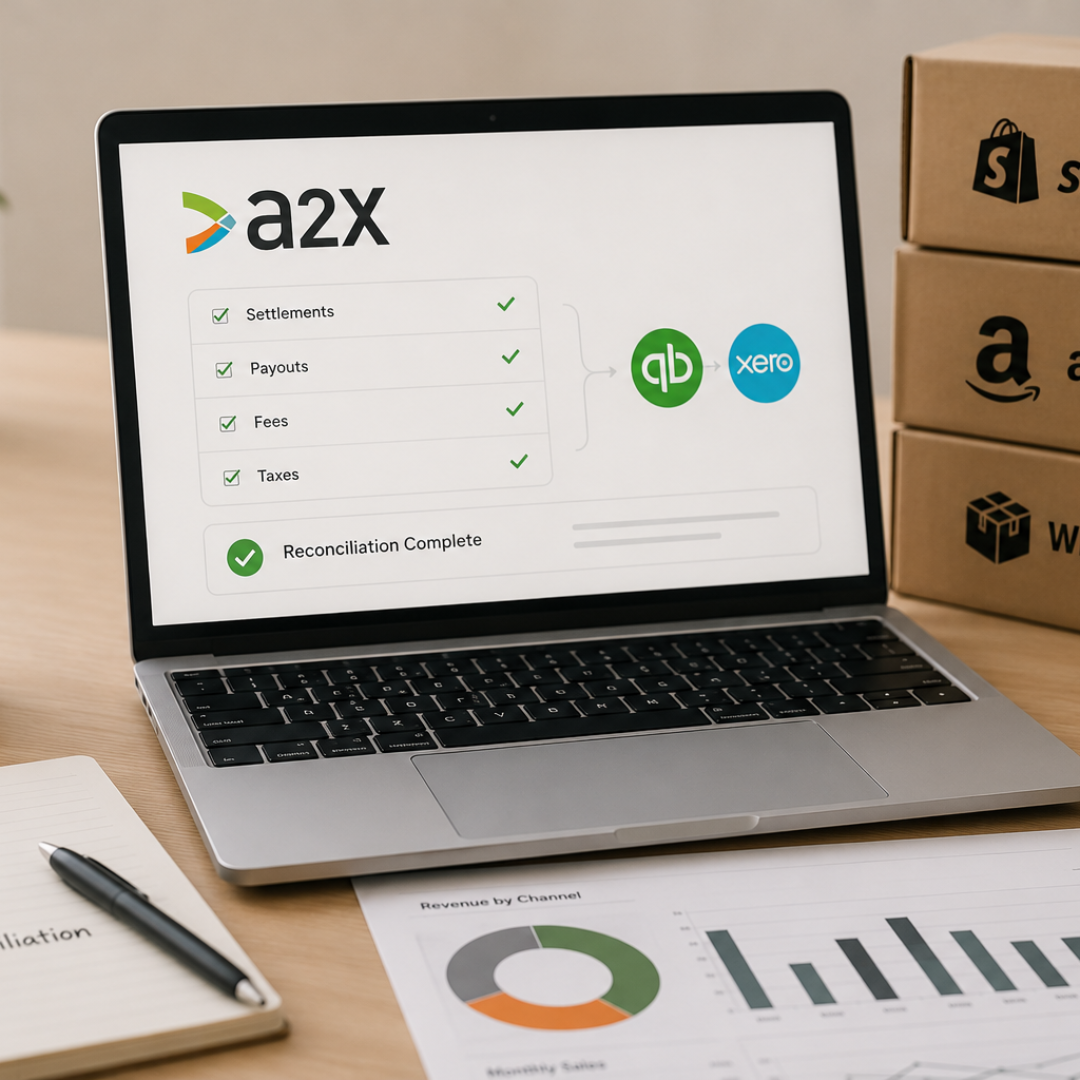
A2X for eCommerce Accounting for Growing Brands
Jun 15, 2026
A balanced, expert take on A2X as an accounting automation tool for eCommerce brands.

Choosing the Right 3PL for Your CPG Brand Operations
Jun 22, 2026
Choosing the wrong 3PL can impact margins, customer experience, and growth.
ROI Room - Podcast
Hosted by the team at FINNESS Advisors, ROI Room goes beyond the numbers to explore the financial strategies, decisions, and lessons that shape successful businesses. From scaling and cash flow to operations, profitability, and becoming investor-ready, each episode brings practical insights from the people building and leading companies today.


Ready to Work with a
Finance Team Built for Growth?
Let's Build the Financial Clarity Your Business Deserves

Receive founder-friendly financial insights—no fluff, just clarity
Company
Services
At FINNess Advisors LLC, we combine expert accounting and financial strategies to help your business grow with confidence.
At Finness, we combine expert accounting and financial strategies to help your business grow with confidence.
© Copyright 2026 FINNess Advisors, LLC. All rights reserved. Designed by Topline